Content is the backbone of effective B2B marketing. Websites, videos, emails, advertising, PR … content is behind it all! In this blog, we cover 7 KPIs that will give you a better understanding of your business-to-business content’s effectiveness.
While content comes in many forms, in this blog we will focus on web content. Mainly blog posts, but anything else that’s responsible for driving organic traffic to your website (like pillar pages or individual solution pages).
When you’re looking at content marketing Key Performance Indicators (KPIs), it’s easy to get lost in the weeds and focus on the wrong metrics.
Why B2B Content Marketing KPIs are Tricky
When you’re planning your 2021 B2B content marketing strategy, know that quantity is key.
The more you write, the more questions you answer.
And the more questions you answer, the more searches you show up for on Google.
The more searches you show up for, the more organic website traffic you receive.
And the more organic website traffic you receive, the more leads you ultimately end up with.
But here’s the problem. If you’re posting useful content 3-5 times a week, you’re going to get a lot of users who want their questions answered. And they may not necessarily drive into your sales funnel right away (if at all). They’re probably going to drive your bounce rate up past 80%.
That’s why it’s important to look at other content marketing KPIs to see how your overall content marketing efforts are working at a high, sustainable level.

7 Best B2B Content Marketing KPIs
- Total website traffic
- Organic website traffic
- Conversions
- Conversion rate
- Number of organic keywords
- Number of Page 1 keywords
- Target Page 1 keywords
The first four KPIs can be found in Google Analytics. The last three are from SpyFu, a keyword research tool our content team loves to use. We’ll walk through how to find each KPI from each source.
KPIs from Google Analytics
Log in to Google Analytics. In the left sidebar, navigate through Acquisition>All Traffic>Channels.
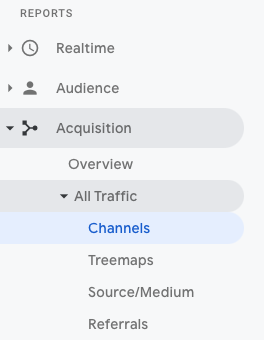
Make sure your date range is set to the appropriate timeline. We look at these metrics weekly, but you can change the time period according to what works for you.
For example, if on Friday morning, Nov. 20, you want to look at the previous week’s traffic, set the date range to Nov. 13-19 – ensuring you’re capturing a full week of traffic, no partial days. You can also select “compare to previous period” to see how metrics changed from the week before.
Here’s what you’ll see (for the sake of these screenshots, we aren’t including the “compare to” data):

OK. This is where you will get everything you need to track the first four content marketing KPIs:
#1. Total Website Traffic
To start, you need to identify total website traffic. This KPI shows you how many users have initiated at least one session in the given time range.
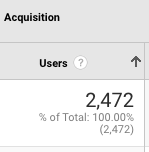
Total website traffic is under the “Users” column: 2,472.
#2. Organic Website Traffic
Next, see what proportion of total website traffic is a result of organic search. This channel is a direct indicator of your content performance. Are you showing up on Google? Are people on your website after deeming your blog or website page the best answer to their question? We hope so!
To find organic website traffic, find the “Organic Search” channel on the left side of the Google Analytics chart.
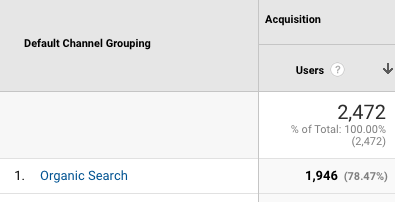
In this example, 1,946 users (or 78.47% of total users) are from Organic Search.
#3. Conversions
Conversions is the total number of times someone completed a goal that you set in Google Analytics. Usually, these goals are “contact us” form submissions, premium asset downloads or newsletter sign ups. Anything that gives you an email – a lead you can actually follow up with!
(Remember, you can see a lot of numbers in Google Analytics, but not individual names or emails, unless they give you that info through a form.)
When looking at conversions as a content marketing KPI, go the right side of the results chart. Make sure “All Goals” is selected, if you have more than one way for someone to convert.
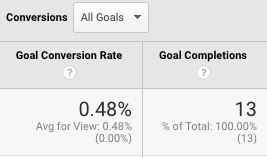
Here, you will see Goal Completions, aka conversions. In this case, lucky number 13!
#4. Conversion Rate
In the same spot as above, you will see Goal Conversation Rate: 0.48%. This rate is calculated as the number of goal conversions divided by the number of sessions, times 100.
Ultimately, you of course want to see your conversion rate improve. But be careful. If you’re growing website traffic because of your content marketing efforts, your conversion rate will decrease if the number of total conversions remains unchanged. This isn’t necessarily a bad thing.
That’s why it’s important to look at how your website traffic and organic search channel grows in relation to the conversion rate.
Let’s move on to SpyFu for the next three KPIs.
B2B Content Marketing KPIs from SpyFu
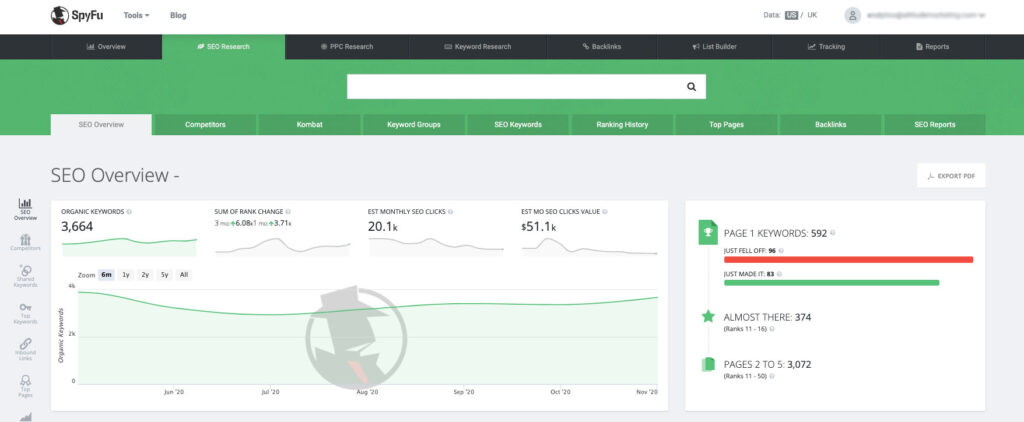
Log in to SpyFu and type your website URL into the search bar. Then, click the SEO Research tab at the top of the page to drill into keywords. Here’s what you’ll see:
Note: SpyFu updates keyword data once a month.
#5. Number of Organic Keywords
First, identify the total number of unique organic keywords. The domain pictured “owns” 3,664 keywords.
This means that when one of these keywords is searched on Google, it shows one of the domain’s links in the Top 50 search results. The more keywords you own, the more you show up on search results, and the more organic website traffic you’ll drive! See how it all connects?
#6. Number of Page 1 Keywords
The total number of keywords is not enough. To get in front of more prospects, you want to be on page 1.
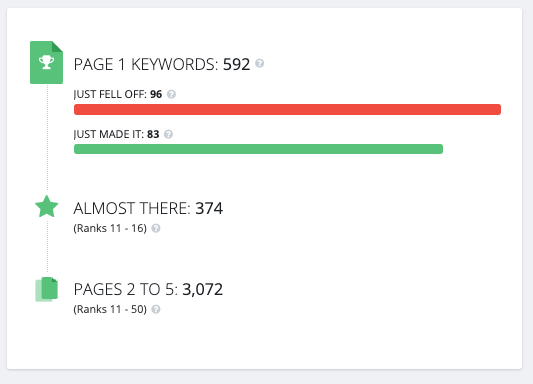
On the right side of this page, next to the timeline, you’ll see a breakdown of where keywords fall in the Google search results by page. First, look at Page 1 Keywords—those that rank in the top 10 results.
#7. Target Page 1 Keywords
Lastly, check out the “Almost There” keywords. These are what we call Target Page 1 Keywords.
If you can write one good blog on a subject that relates to an “Almost There” keyword, you can likely bump your domain to Page 1 for that search term. That’s a quick win to boost organic traffic. SEO is typically a slow burn, but it’s also good to look for opportunities like this – especially if you’re out of content ideas.
tl;dr: B2B Content Marketing KPIs
After a month or two of tracking these B2B content marketing KPIs every week, you should have a good baseline idea of how much traffic you usually get and how your content marketing efforts are going. Then, see what you can try next or if anything needs to be refined moving forward.


