These days, every B2B marketer worth his or her salt just loves to talk about data. And for good reason: When it comes to B2B marketing data, we’re pretty much living in a golden age.
Actually, better put: When it comes to the quantity of B2B marketing data available, we’re living in a golden age. Quality and usefulness? Not always so much.
There’s a problem with data in today’s marketing landscape: Most of it’s crap. That’s not because the numbers are bad, necessarily; they usually are what they are. It’s the marketers who screw things up. They’re usually not using what’s available to them to its fullest, and – if they are – they’re often not measuring the right things.
Kind of like I was. Or wasn’t. Not sure if that’s a double-negative.
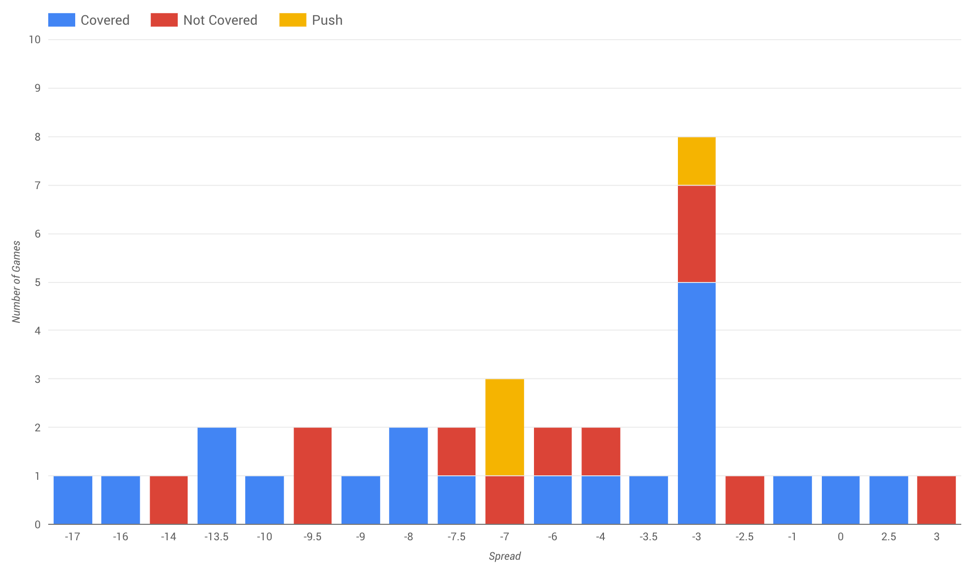
Full disclosure: This post started a few weeks ago as an attempt to use the coming NFL conference championship games as a way to illustrate the steps involved in gathering, cleansing, visualizing and analyzing large datasets. There were tenuous links to B2B marketing, and plenty of mixed metaphors. And it all started with this 2,928-cell dataset (mined from Pro Football Reference) focused on the four remaining playoff teams’ historical performance against Vegas odds in sub-30 degree weather.
It was fun! The visualizations were cool! The Vikings played a ton of cold-weather games on grass in the 1960s! A surface called Astroplay exists! Since 1999, the Patriots have covered the spread five of eight times when favored by exactly three points!
Remember the part about measuring the wrong thing?
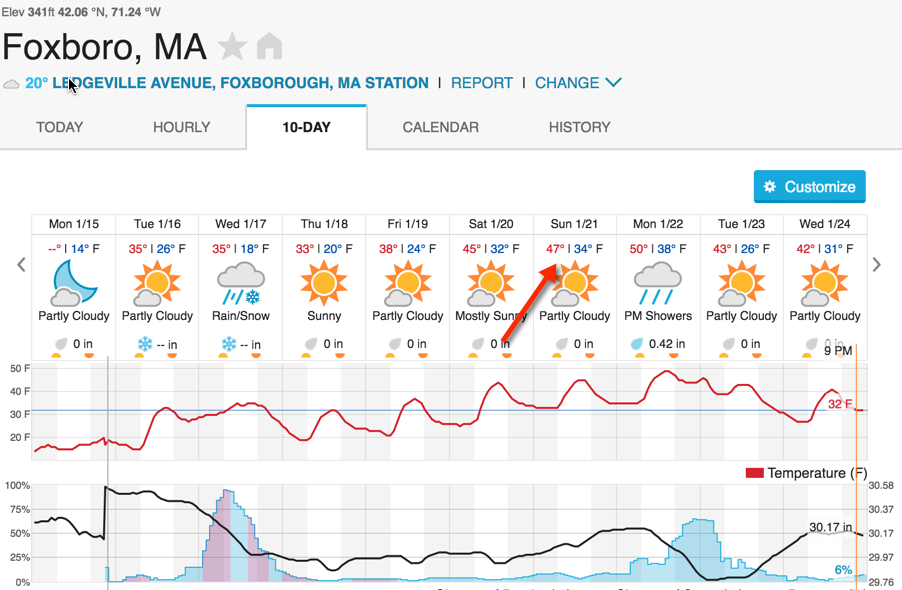
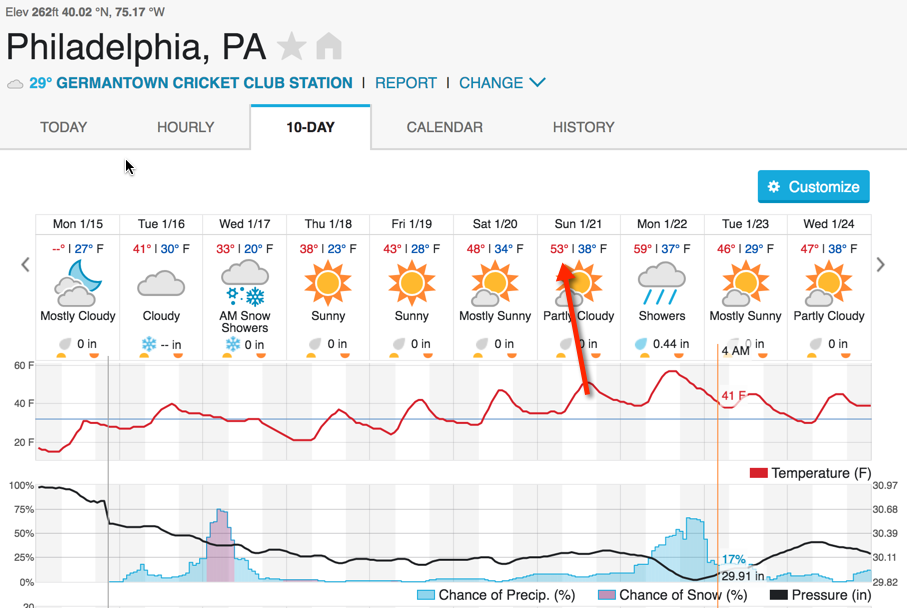
Most B2B marketing data analysis sucks. Why? The goals of the exercise are wrong. Fundamental concepts are flawed. The wrong questions are being asked. Kind of like when you spend a few hours measuring playoff teams’ performance in cold weather … before checking the forecast.
So … yeah. About that deep dive into cold-weather play … not relevant.
The point? Truly understanding your data and what you’re actually trying to measure means more than having things nicely cleaned up. If you’re looking at things in a vacuum, you’re wasting your time.
So, let’s measure something meaningful.
The biggest thing left in the NFL Playoffs – other than the growing legend of Nick Foles – is Tom Brady. For the non-football fans reading, Brady’s spent the better part of two decades deflating his opponents and making his case as the best postseason quarterback ever. Is he?
Let’s be honest. I’d argue that yes, Brady is the best quarterback ever — postseason or not — but data points that would unequivocally support my believe would be important if I wanted to convince an unbeliever going into this weekend’s matchup.
So … data!
Step 1: Data Collection
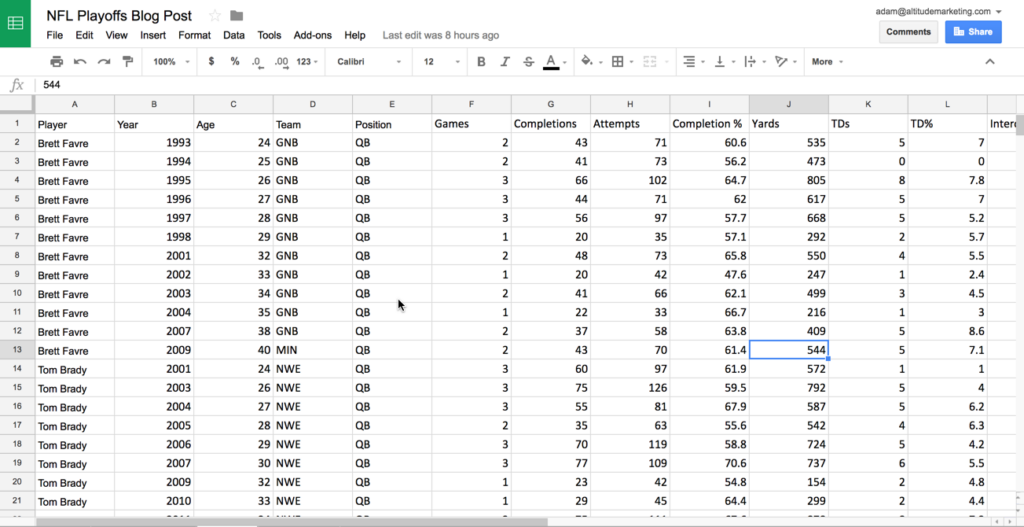
The first step in any data analysis project is collection. In marketing, that means pulling together metrics and statistics from automation platforms, web analytics engines, CRMs and apps themselves. For fun, it means hitting a Sports Reference site. In this case, we’ve used Pro Football Reference data to build a CSV of the playoff-only statistics of the 10 quarterbacks with the most postseason passing yards. (You can download it here, if you want to play around.)
(We’re big fans of flat data files here at Altitude. Complex databases have their place, but pretty much every application that doesn’t integrate directly with BI platforms speaks CSV. The KISS principle applies; don’t overcomplicate things.)
Step 2: Data Cleansing
If your data isn’t clean, it’s not going to play well with an analysis platform. In particular, when it comes to Excel or Google Sheets:
Columns need to be filled with consistent data (even down to abbreviations and capitalization)
Headers need to be written in a human-friendly fashion (e.g., Yards vs. yds)
Duplicate column headers need to be changed
Dates need to be formatted correctly (YYYYMMDD vs. Month Date, Year; Google Sheets does this under Format>>Number)
Blanks need to be filled with a zero or deleted
Remember: Data analysis tools aren’t human, and they can’t account for small human errors (well). Taking a few moments to spin through your dataset will save you quite a bit of time when you get to …
Step 3: Data Visualization & Analysis
Here’s the fun part! Once your dataset is built and cleansed, you can start slicing, dicing and drawing conclusions. The visual format – logical charts and graphs, rather than numbers – makes all the difference; outliers and leaders are easy to spot, and trends become evident very quickly. After all, what’s more valuable to a human?
This:
Or this?
Getting back to our thesis, can our dataset prove Tom Brady is the best postseason QB ever? You be the judge.
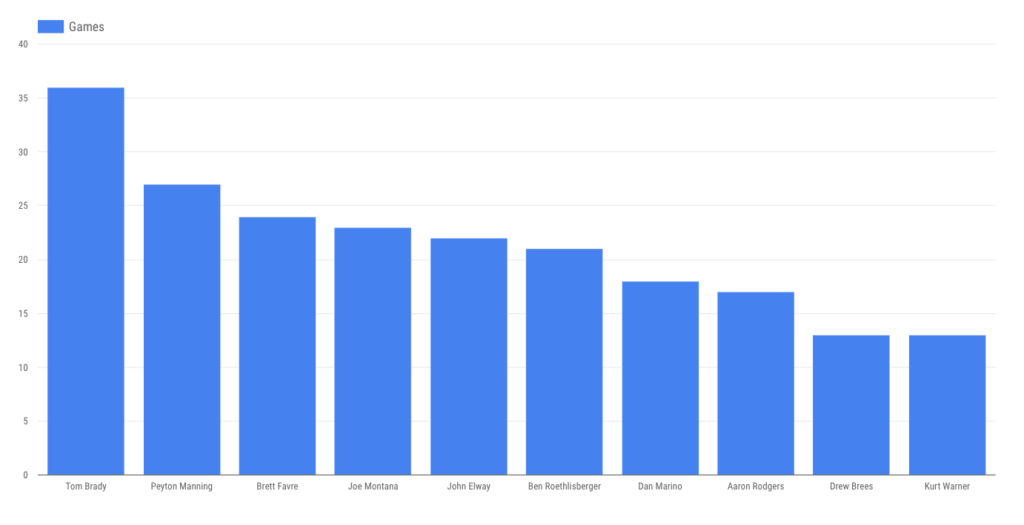
Of our sampled players, Brady has played by far the most playoff games:
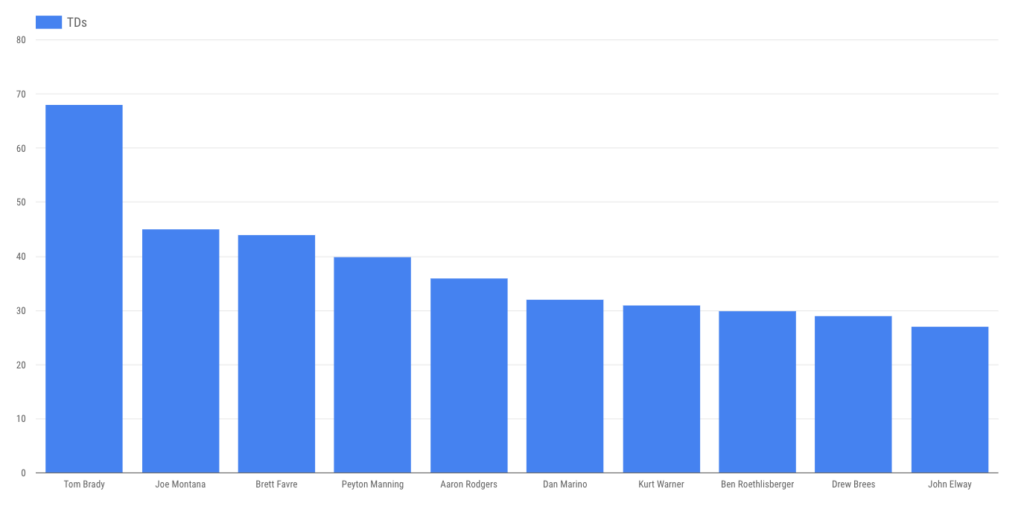
… making it somewhat unsurprising that he’s thrown the most touchdown passes …
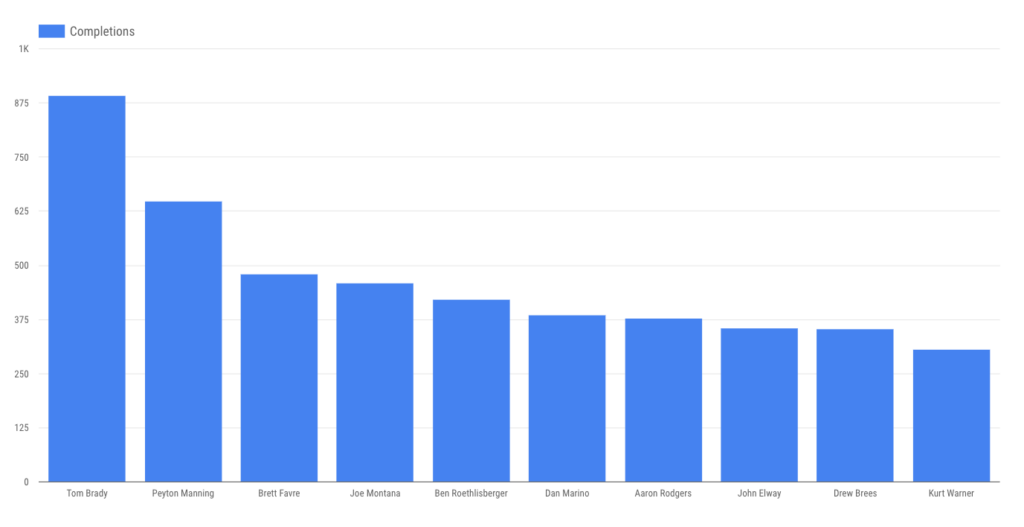
… completions …
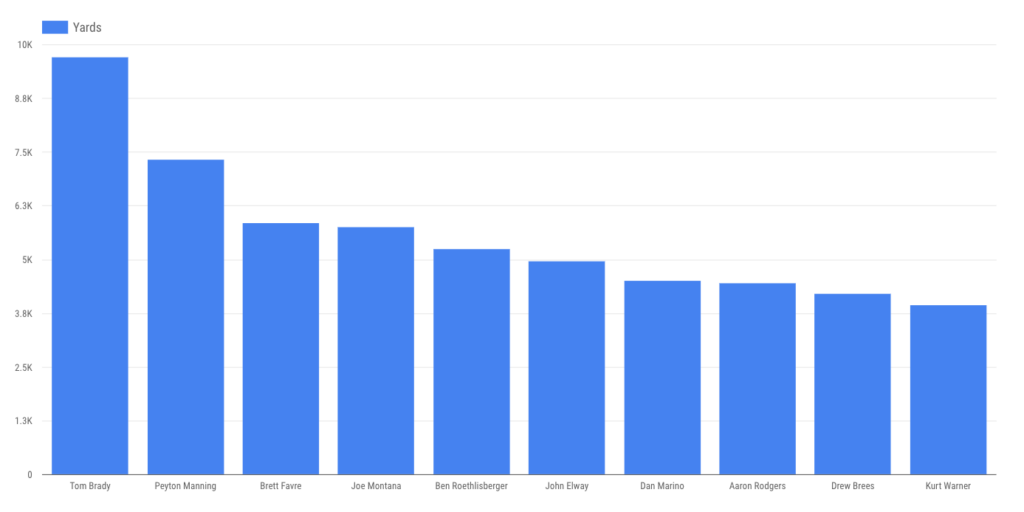
… passing yards …
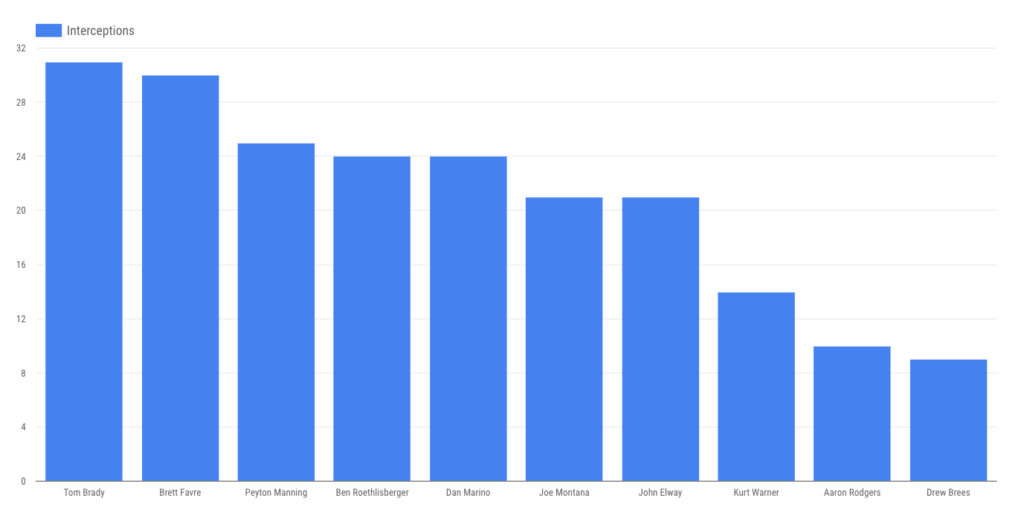
… and interceptions. (Though gunslingin’ Brett Favre is close.)
Case closed? Not quite. Let’s get a bit deeper.
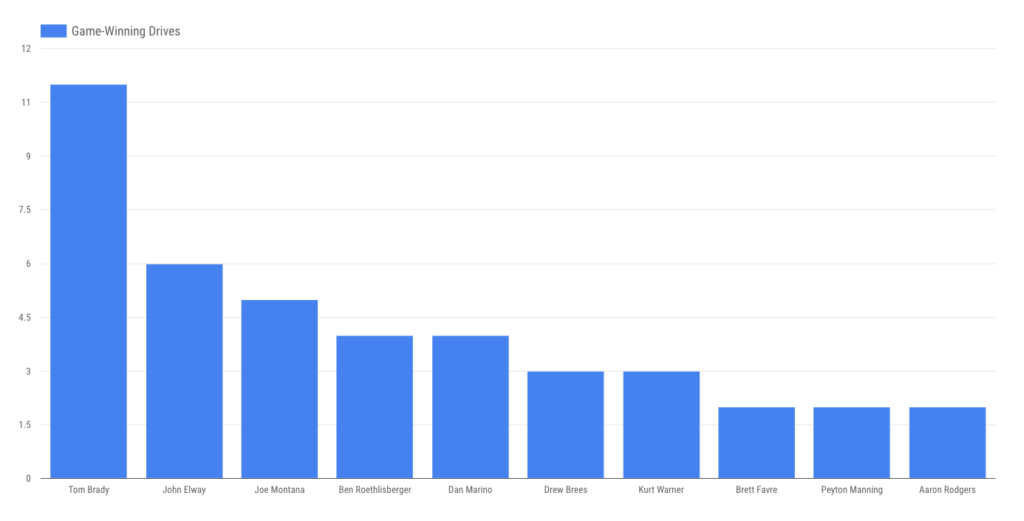
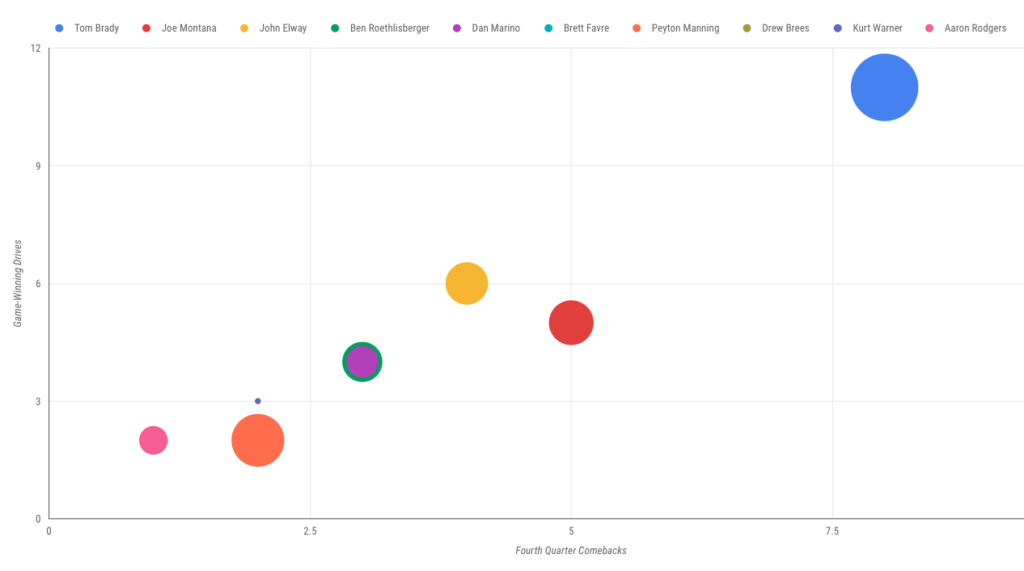
Brady’s playoff legend is built in large part around late-game heroics. How does he stack up there against our group of 10? Remarkably well, it turns out, when you plot fourth-quarter comebacks and game-winning drives on a scatter plot. (He’s blue, naturally; bubble size is determined by games played.)
So … that’s that. Stacked against the most prolific playoff passers of the modern era, with data sliced, diced and visualized, Brady’s just about impossible to top. Any wonder he’s looking for ring No. 6?
This dive into data is the first of many you’ll see here on the Altitude blog. We’re nerds, and this is fun for us. Have a dataset you’d love to get more out of? Zip it over to adam@altitudemarketing.com and it might make a post. Want another view of this NFL playoff set? Let us know in the comments, and we’ll make it happen.
Andrew Stanten
Andrew Stanten co-founded Altitude Marketing in 2004. As CEO, he ensures the right people are on board, delivering world-class marketing services to Altitude’s global client base, and staying true to Altitude’s mission, vision and values.
Andrew possesses an innate ability to process, organize and summarize massive volumes of client and market information and turn it into actionable, strategic thinking. This enables Team Altitude to get smart about a company quickly—and develop winning, integrated approaches that vault clients into a position of prominence and strength.
Andrew graduated from Syracuse University and earned his MBA from Lehigh University.
 Skip to content