Skip to content


Note: This blog was updated November 2024.
Business-to-business marketers know that email helps reach customers and leads. But how do you know if it’s working? B2B email analytics, that’s how!
At the end of the day, you need leads and conversions. And if any of them come from an email, your email marketing efforts are working.
But it can be tricky to tie leads back to emails. Especially in the long B2B sales cycle, not every prospect is ready to convert, even if they clicked a link in your latest campaign. Often, these leads will go back to your website another time, separate from an email.
This speaks to an important B2B email marketing truth:
The point is to keep your brand top of mind.
So, you shouldn’t look at your email marketing strategy in a vacuum. If you have steady open and click rates, growing website traffic and a nice flow of leads, your email marketing is probably working.
Remember, it’s just one piece of the integrated marketing puzzle.
Even so, it’s important to keep a pulse on your B2B email analytics. You can’t improve if you don’t know what is or isn’t working.
To help you figure this out, I’m going to walk you through my own process I follow when I look at email reports.

B2B Email Analytics: Reading Your Report the Right Way
How to Read B2B Email Reports
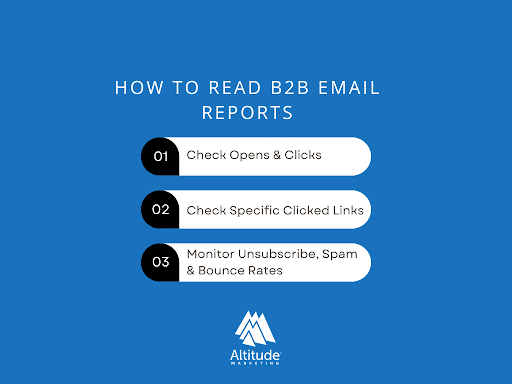
Step #1. Check Opens & Clicks
When you log into your email platform – for many of our clients, it’s Campaign Monitor – navigate to your recent email sends.
The first thing I do is take a look at the open and click rates:
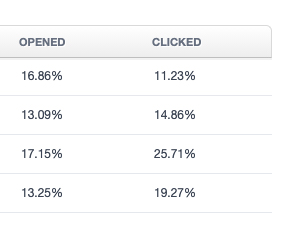
A quick glance at these numbers next to other sends will help you see how the email performed.
Variance is normal. But if you usually get a 15% open rate and the email you’re analyzing had a 5% open rate, that’s a red flag you will want to investigate.
(This is the power of B2B email analytics.)
From here, I will click into the specific email I’m analyzing to dig deeper into the details.
Step #2. Check Specific Clicked Links
Some emails are designed to drive traffic to your website. Others are just for communicating value, and that’s okay.
But if you sent an email with the intent to get people to click through to your website, you should drill into the click rate by seeing who clicked what.
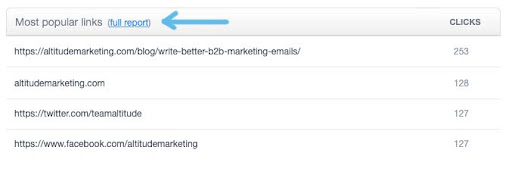
On the main dashboard of a sent campaign, you will see this chart. This gives you a quick view of how many times a particular link was clicked. But click “full report” for even more information.
There, you will see the amount of unique clicks compared to the total number of clicks. In this example, the 253 clicks to the blog were made by 193 different people. That’s 193 people on our blog. Pretty cool!
Step #3. Monitor Unsubscribe, Spam & Bounce Rates
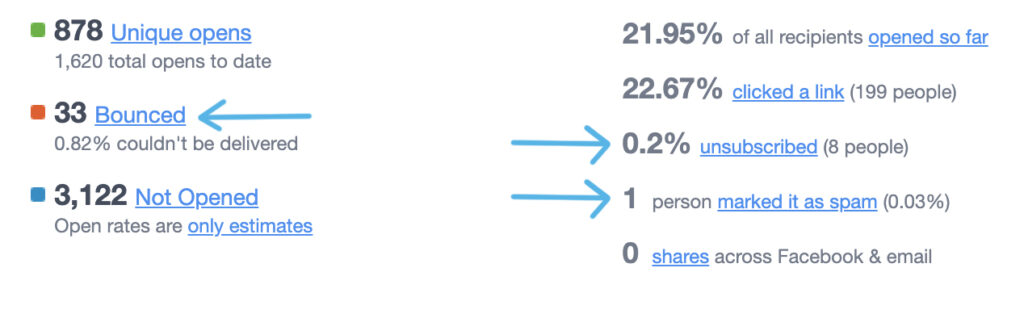
Now it’s time to look at the scary metrics in your B2B email reports. In Campaign Monitor, you can get a quick snapshot of your unsubscribes, spam markings and bounces on the main dashboard of a sent campaign.
These metrics don’t have to scare you!
In fact, some list churn is normal. Unsubscribes under 2% are within industry norms, and this can provide you with some good insight on the people reading your emails, what they like (or don’t like), and how you can improve.
At the end of the day, you want to be sending your content to relevant people who are interested in eventually paying for your product or service. So, if you see a spike in unsubscribes, don’t panic. If you want high opens, clicks and conversions, you need a highly targeted list of subscribers. Maybe those who unsubscribed, if they had stuck around, would have otherwise weighed down your other metrics.
When it comes to spam and bounce rates, you want to keep an eye on these to avoid any technical issues that prevent you from sending emails in the future. This all comes down to practicing good email habits and maintaining good list hygiene.
- Some basic habits to help you avoid excessive spam markings:
- Don’t buy subscribers
- Limit the number of emails you send in a week
- Use clearly labeled “from” field addresses
- Certify your IP address
- Only send content that the recipient signed up for and expects
- Email lists are constantly in flux. So, list hygiene is really important for effective email marketing. Always make sure you’re keeping your list clean and up-to-date to ensure low spam flags and bounces.
What’s a Bounce Rate?
Your bounce rate is the percentage of your sent emails that could not be successfully delivered to the recipient’s inbox.
Sometimes this is due to invalid, closed or non-existent email addresses (hard bounce). Or, your recipient’s server is automatically classifying your email as junk or spam.
Other times it could be a temporary error due to down servers or full mailboxes (soft bounce).
Having a high volume of email addresses on your list that hard bounce is dangerous to your sending reputation. So, emails that hard bounce should be removed from your contact list (or, find an email platform like Campaign Monitor that automatically suppresses contacts that hard bounce).
Keep an eye on the emails that soft bounce. If they continue to bounce, remove them from your list, too.
Here is an table highlighting the impact of each steps:
Steps | Impact |
Check Opens & Clicks | Allows for quick assessment of email effectiveness and identifies potential issues such as low open rates. |
Check Specific Clicked Links | Provides insights into audience behavior and the effectiveness of email content in driving website traffic. |
Monitor Unsubscribe, Spam & Bounce Rates | Helps in understanding audience sentiment, maintaining list hygiene, and ensuring future email deliverability. |
Other B2B Email Analytics Tips
- Give your email time. Look at your B2B email analytics about a week after you send the email. People are most likely to engage within three days of the email, but there could be stragglers.
- Put it in context. Look at benchmark data and data from your email history to put this send in context with the rest of your campaigns. What do you normally see for your emails sent to the same list? Is this an outlier?
- Look at Google Analytics. If driving website traffic is your goal, don’t forget to log into Google Analytics and see if traffic increased after you sent the email. You can look at a specific page (like a blog) and see the number of people who entered that page, where they come from and even where they navigated next. This is a good way to verify that people who “clicked” were real and actually read the blog.
Caveats to B2B Email Marketing Reports
- Email marketing data is misleading. Who you’re sending to impacts results, and all engagements are not equal.
- Don’t drill too deep into individual recipient data. Results get funky at that micro-level. Email reports can only capture so much. For example, you might see that a contact opened and clicked every single link at 11:01 a.m., exactly 1 minute after the campaign sent. This was probably just their email server checking links for spam. But when you zoom back out, this doesn’t mean the holistic data isn’t accurate. It’s just a little fruitless to drill down into specific user behavior.
Conclusion
The bottom line: When you’re looking at B2B email reports, make sure you’re looking at everything … but be skeptical.
Metrics are important to track, but be careful not to overanalyze them. As long as nothing too crazy is happening in your email reports, you should be okay. Instead, focus on providing value through your email content. Even one more qualified eye on your website from an email is better than nothing.
FAQs
1. Why is B2B email analytics important?
Email analysis helps identify strengths and weaknesses in campaigns. This understanding can be used to improve strategies so that they resonate with clients more effectively.
2. How can I check if my email campaigns are working?
Check open rates and click through rates. If you see low open rates, declining clickthroughs or other signs of disengagement, it may be time to reevaluate your strategy.
3. What should I do if I notice a low open rate for a particular email?
A subject line test could help determine whether or not this was the problem area. Or maybe there was something off about when it was sent out? Review these factors alongside any others you think may have contributed before moving forward with another campaign – hopefully one that performs better!
4. Should I be concerned about unsubscribes and spam markings?
Keep an eye on bounce rates too as they can indicate deliverability issues. A high number of unsubscribes might mean people are disinterested in what you have to offer while many spam complaints could lead ISPs blocking future emails from being sent.