Note: This blog was updated November 2024.
B2B SEO is hard work. It can take months or years to see significant results. B2B companies need an easy, effective way to measure their SEO performance.
![How to Measure SEO Performance: Guide for B2B Marketers [6 Steps] How to Measure SEO Performance: Guide for B2B Marketers [6 Steps]](https://altitudemarketing.com/wp-content/uploads/elementor/thumbs/young-successful-developer-working-with-computer-w-2023-11-27-04-51-57-utc-scaled-qnrhjtl0ko0hgju9c3j4kjw2gxo3xpjhnlle7cdc2m.jpg)
How to Measure SEO Performance: Guide for B2B Marketers [6 Steps]
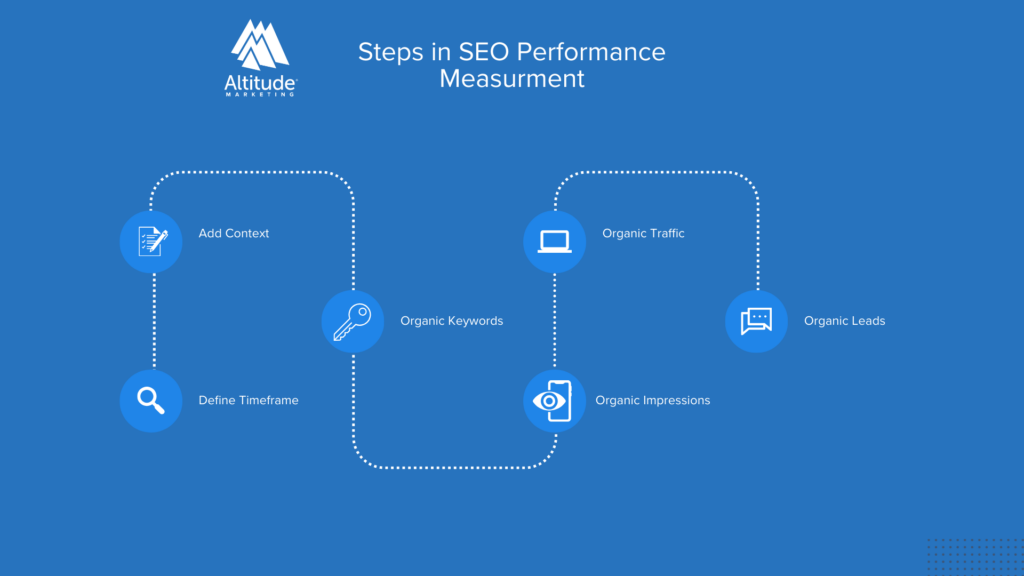
In this post, we break down the six steps to measuring the long-term SEO and lead generation performance of your B2B website:
- Defining a timeframe
- Adding context
- Understanding organic keywords
- Checking out impression opportunities
- Segmenting organic traffic
- Building for conversion rate optimization
This guide will show you how to answer big picture questions you have about SEO performance.
- Are our current SEO efforts working?
- Are we becoming more visible?
- Is SEO driving leads?
If you’re looking to evaluate content performance on a more granular level, check out our guide to content marketing KPIs.

Defining a Timeframe
Before you start analyzing your search engine optimization success, you’ll need to decide how far back you want to look.
If you’re just learning about your website’s performance, you’ll probably want to get the big picture by going back 2-5 years. You might look at the entire history since you launched your first website.
If you’re already up to speed, you’ll want to do a 3-, 6- or 12-month timeframe. (You should look at this every month, but select a timeframe for how far back you’re looking).
Adding Context
Once you’ve defined a timeframe, you’ll need to add context. Take stock of significant milestones and events that could affect your SEO. These include:
- New website launch
- When you started blogging
- A change in blogging frequency
- Major edits to content
- Website performance improvements
- Global pandemics, apparently
It’s also worth keeping an eye on the latest algorithm updates from Google. They won’t tell you exactly what they changed, but you can glean enough to provide context to your analysis.
All of these events will serve as data points for interpreting the raw data we’ll review below.
Organic Keywords
Am I ranking on Google?
Every B2B company has this question when they realize how powerful SEO is. To answer this question, you can – and should – Google key terms you want to rank for and see where you show up.
But to see the bigger picture, you’ll need a tool that aggregates all of the searches you appear for.
Spyfu is a tool that helps with measuring SEO performance. Their organic keywords graph lets you see the number of keywords you appear for over time. This metric roughly equates to a measure of your visibility in organic channels.
![How to Measure SEO Performance: Guide for B2B Marketers [6 Steps]](https://altitudemarketing.com/wp-content/uploads/2024/05/image3-2.png)
Once you’ve pulled up the chart, you’ll need to interpret it. Most website’s follow a pattern of “two steps forward, one step back.” So don’t worry about the slight dips between months of growth. Focus on the big picture.
Does the graph trend up or down? By how much? Knowing the answer is key to measuring SEO performance – particularly in the B2B world, where deals can measure tens of thousands of dollars.
Now, take that answer and analyze it with the context you gathered before. Here are some common patterns and conclusions:
- If you launch a new website, the keywords usually dip for 1-2 months then experience strong growth.
- Increasing posting frequency usually accelerates growth.
- If you stop posting and your keywords plummet, that’s a clear sign you need to post more.
A good target growth rate is 10% per month. Growth compounds, so if you maintain a 10% growth rate for a year, you’ll see a 185% improvement in your visibility.
You can also compare yourself to your competitors to put things into context. (You can see this data for every single website in the world.)
By now you’ve established if your website ranks on Google and evaluated how that’s changing over time. Now we need to connect SEO performance to the thing everyone cares about: leads.
But to do that, we’ll have to make a few stops on the way.
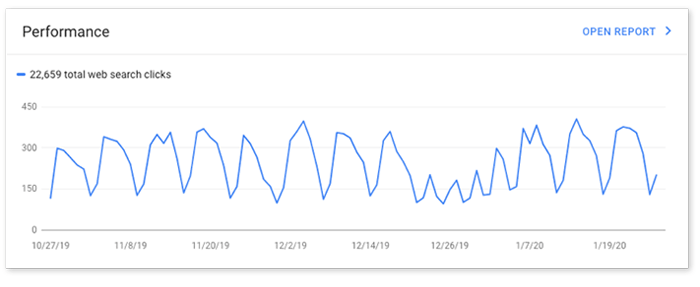
Organic Impressions & Clicks
Spyfu’s organic keywords measures how often you ranked for a search term. Organic impressions measure how often someone saw you in those searches.
In Google Search Console, click the Performance tab and set the date range to your chosen time frame.
Then, compare the total impressions graph to your organic keywords graph and draw a conclusion. Ideally, long-term keyword growth correlates to growth in impressions. This proves that your SEO efforts turned into someone seeing you.
That raises another question: did they click?

To answer this question, look at the Total Clicks graph that’s next to the impressions. Again, compare this to your previous data and draw a conclusion. If there’s an upward trend, that means your SEO efforts are leading to more people clicking onto your site.
And that leads to …
Organic Traffic
This is the metric that measures how many people arrived on your site through organic channels. This metric is significant because it demonstrates how all of the work you’ve put into SEO translate to people on the site. It’s also directly tied to leads. (More on that soon.)
To evaluate organic traffic, follow these steps:
- Open Google Analytics
- Click Acquisition, All Traffic, Channels
- Scroll down and click Organic Search under Default Channel Grouping
- Set the date range to your chosen time frame.
This gives you a clear overview of the number of users coming to your site because of SEO. Again, compare this to your previous data and draw a conclusion. If it exhibits an upward trend that correlates to your organic keywords, search impressions and search clicks, then your SEO efforts were successful in getting people on your site.
At the end of the day, SEO success is defined only by the number of people you get on your website. But to demonstrate the value of SEO and its effect on the bottom line, you have to push just a bit further.
Organic Leads
The number of leads you generate comes down to a simple math equation:
Organic Traffic x Conversion Rate = Conversions
(Conversions are leads that filled out a form on your website, but have not been qualified for marketing or sales.)
By now you’ve proven that your SEO efforts are responsible for an increase in Organic Traffic. Now, we’ll take a look at the conversion rate.
To analyze your conversion rate in Analytics:
- Click Conversions, Goals, Overview
- Click on the graph for Conversion Rate
- Set the date range to your chosen time frame.
The goal here is to establish your conversion rate as a fixed variable. That’s because on most sites this metric is very stable, typically 1-2%. (If your rate dropped, then you have some conversion rate optimization to work on.)
If your organic traffic went up and your conversion rate increased or remained the same, you should have generated more leads.
To confirm this, click the tab above the graph and select Goal Completions. These are your total website leads. Given the context we’ve established so far, an increase in goal completions means your SEO efforts have successfully driven more leads for your business.
Bonus step: check with your sales team and make sure you’re driving the right types of leads. If there’s an issue, you’ll need to reevaluate your content strategy.
Next Steps to Measure SEO Performance
In this guide we assumed that all of the outcomes were favorable. This can happen. But the internet is a messy place. Traffic can disappear, leads dry up and sometimes data is hard to interpret.
If your SEO performance isn’t stacking up, take a second look at the data and see if you can draw any conclusions. It’s likely you’ll be able to tie issues with your SEO performance to one of a few common issues:
- Lagging website performance and accessibility
- Misaligned content strategy
- Ineffective metadata
- Weak conversion rate optimization
But if you’re lucky enough to have a winning SEO formula, you now have the hardest task there is in marketing: to continue doing something that works.
In an industry inundated with constant change, it’s tempting to pivot on a monthly basis. Sticking to the same strategy for months or years can feel equally challenging and boring.
But if you find a winning formula for driving organic growth, you should hold onto it tight and never let go.
FAQs
How does SEO impact lead generation for B2B companies?
SEO incrеasеs visibility and organic sеarch traffic, which lеads to morе еngagеmеnt on your sitе. Effеctivе SEO stratеgiеs еnsurе that this traffic is rеlеvant, improving thе quality of lеads and potеntially incrеasing convеrsion ratеs.
Can social media metrics be integrated into SEO performance tracking for B2B?
Yеs, intеgrating social mеdia mеtrics can providе a morе comprеhеnsivе viеw of your digital markеting еfforts. Social еngagеmеnts and sharеs can indirеctly affеct SEO by incrеasing visibility and driving traffic, which may rеsult in backlinks that boost SEO.
How often should I review SEO performance metrics for my B2B site?
It’s advisablе to rеviеw kеy SEO mеtrics on a monthly basis to track progrеss and idеntify trеnds. Howеvеr, for a morе dеtailеd analysis, a quartеrly rеviеw might bе morе appropriatе to assеss thе impact of spеcific stratеgiеs and makе nеcеssary adjustmеnts.


