Note: This blog was updated December 2024.
When you first start using business or marketing analytics software like Google Data Studio, it’s common to be confused by the fundamental units of any chart: metrics and dimensions.
Fortunately, once you get your head around them, they make all the sense in the world.

Metrics vs. Dimensions: Using Them in Google Data Studio
Metrics vs. Dimensions: Measurements & Stuff
Whether you’re using Google Data Studio, Google Analytics, Adobe Experience Cloud, Excel or any other piece of software that lets you turn raw analytics data into charts and graphs, you’re going to run into metrics and dimensions – and they’re going to be confusing at first. Your first few charts will probably look like nonsense. That’s fine! It isn’t the most intuitive thing in the world.
Here's the rule of thumb for working with metrics and dimensions:
- Metrics are measurements
- Dimensions are what you’re measuring or what you’re measuring by
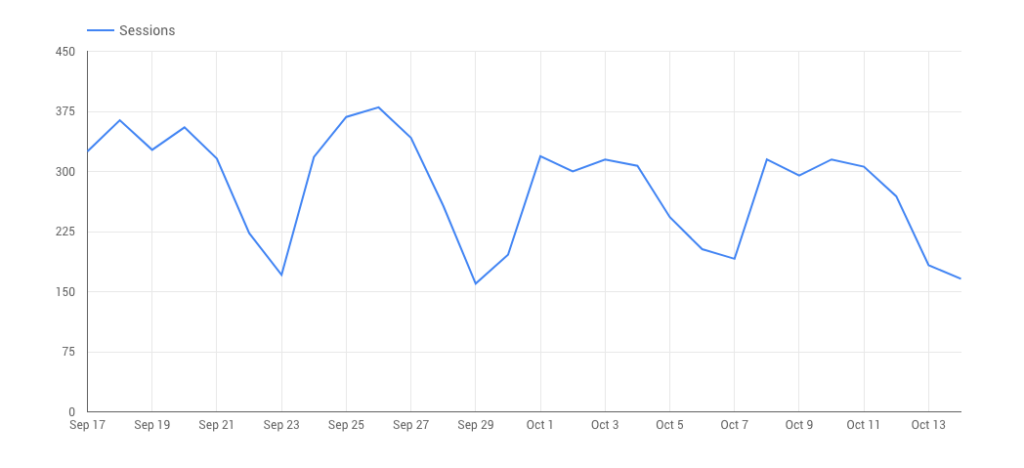
Let’s take the example of one of the most common charts in marketing – website traffic over time. In the below time series (a type of bar chart that measures linked data over time), you see a dimension and a metric.
- The dimension is time – in this case, the days on the X (horizontal) axis. This is what we’re measuring by.
- The metric is sessions – the count on the Y (vertical) axis. Like all metrics, it’s quantifiable – a number.

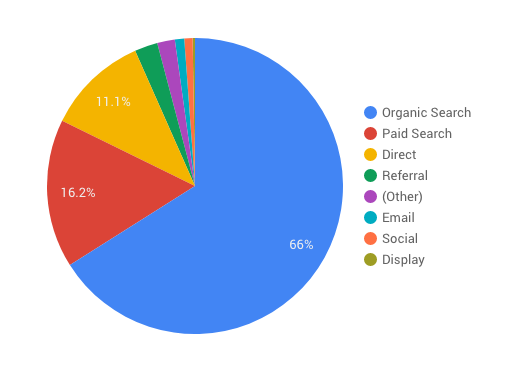
Here’s another example. In this pie chart, the dimension is Google Analytics’ default channel grouping – the eight most common ways users find a website. The metric is sessions – how we’re counting the dimension.

How do you tell a dimension from a metric?
The most common way to tell a dimension from a metric in business intelligence is that a metric is always expressed in a quantifiable way – it’s a number, an amount or a unit of time. It’s not just a word … you can’t count “organic search,” for instance. (That’s not to say you can’t quantify a dimension and turn it into a metric. Imagine Excel’s COUNTIF function – a list of individuals who filled out a lead gen form can’t be a metric, but the number of them can be.)
Dimensions, on the other hand, are always words. Months can be dimensions. Product names can be dimensions. User genders can be dimensions. Country ISO codes can be dimensions. They’re things – what you’re measuring.
Metrics vs. Dimensions in Google Data Studio
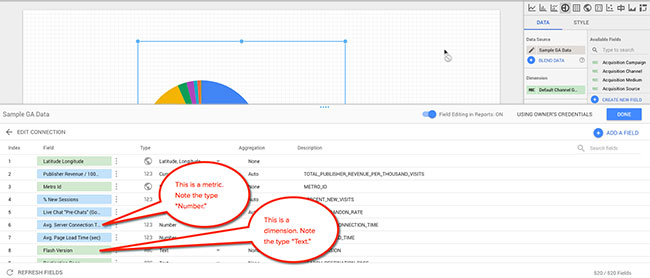
Google Data Studio makes it very easy to distinguish metrics vs. dimensions. In the platform (which is our favorite marketing analytics solution), metrics are always blue and dimensions are always green. Each has types that define how it can be used. A dimension in Data Studio is usually text, geographic coordinates, a Boolean choice, a date or time or a URL. A metric can be a number, a percentage, a duration or an amount of currency.

Metrics are further broken down by how they’re aggregated. You can use the “sum” – pretty much the measurement itself, an average, a count, a count distinct (the number of individual items, not the sum total), the maximum or the minimum.
For instance, if you were to run a chart of website user sessions per day, you’d select “date” as your time dimension and sessions aggregated as “sum” as your metric. If you wanted the mean number of sessions per day, you’d select “date” as your time dimensions and sessions aggregated as “average” as your metric.
Need a hand with your marketing analytics, or just a deeper dive into metrics vs. dimensions as they pertain to your data? We’d love to help! We’re a full-service marketing agency that specializes in unleashing the power of data to get results for our clients. Contact us today, or call 610-421-8601 x122 to get the ball rolling


