If you’ve worked on the web in the last year or so, you’ve definitely heard about Lighthouse. Google’s UX testing tool is a tremendous resource for developers and designers.
Problem is, the reports it kicks out can be a bit tough to interpret.
I mean, where’s “site speed”? Is that part of “Performance”?
Why are some things listed twice?
Aren’t all of them “Best Practices”?
And does it all play into SEO?
Have no fear!
We’ve broken down how to read a Google Lighthouse report in our latest B2B Marketing Tips video. In it, you’ll learn:
- Why your mobile website is more important than ever (even if it gets no traffic)
- The two most important factors to the “Performance” score on Lighthouse
- Why the “SEO” score in Lighthouse isn’t really about how good your SEO is
- How to make your website friendlier and more useful to individuals with disabilities
How to Read a Google Lighthouse Report
As intimidating as Google Lighthouse Reports are, they’re pretty simple once you break them down.
To start, run an audit of your site at web.dev/measure. That’s the main portal to Lighthouse, which is the successor to the old PageSpeed Insights tool.
PageSpeed Insights still works, by the way. (It’s actually powered by Lighthouse.) But what you get on web.dev is way more actionable.
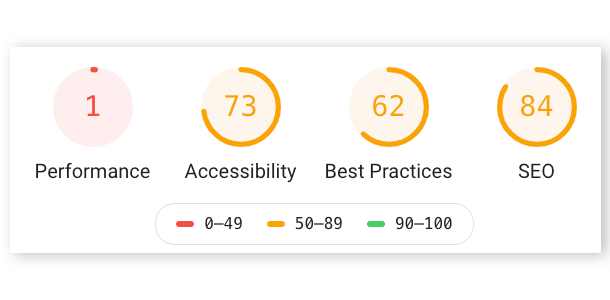
You’re going to see four scores on a 100-point scale:

Lighthouse Performance Score
The Performance metric is the closest analogue to the old PageSpeed Insights score. One difference: It’s only mobile. There is no Lighthouse desktop scoring. It’s always from an emulated Android mobile device.
Performance comes from six factors. Two of these really matter.
- First Contentful Paint is how long it takes before your site gives feedback to the user that it’s loading. The goal is to reduce the “white screen” effect while the site is spinning up.
- Time to Interactive is how long before your site is … interactive. Loading feedback is great. Being able to use a site is better.
Lighthouse offers a ton of feedback on precisely what’s slowing your site down and how to speed it up. When you read a Google Lighthouse report, this is the most important information.
Performance is the one piece of Lighthouse scoring that we know factors directly into the Google algorithm. For SEO purposes, it’s the most important thing.
(Yes, more than even the “SEO” score.)
This should be 70, minimum, for a high-performing site.
Lighthouse Accessibility Score
Your website should be accessible to everyone, including those with disabilities. The Lighthouse Accessibility score is a rough measure of this.
Accessibility takes into account WCAG guidelines and ARIA to ensure that everyone has a great experience on your site.
We’ve talked about accessibility (and especially color contrast) before. But here’s the key:
Accessible design is good design.
It’s a moral imperative that your site be accessible to everyone.
The bonus is that an accessible site is better for everyone.
When you’re reading a Google Lighthouse report, it’s easy to ignore Accessibility. Don’t. This should be 90+, every time.
Lighthouse Best Practices Score
The Lighthouse Best Practices score largely speaks to security factors.
There isn’t much here that can be addressed by marketers themselves. Instead, this section of the Google Lighthouse report is best handed off to the web development team. They’ll know what to do.
(Spoiler alert: Using old, vulnerable versions of JavaScript libraries is a bad thing.)
Lighthouse SEO Score
This is not the part of Lighthouse with the biggest impact on SEO.
That’s Performance.
Weird, right?
Instead, the SEO part of a Google Lighthouse report is about doing the bare minimum.
This is looking for table stakes stuff: a meta description, title tag, alt attributes on images, etc.
There is no excuse for a good site not to be over 90 here. It doesn’t mean you have “good SEO.” But it means you’re set up for it.


